The calendar says it is early June, and astronomical summer is only a few weeks away, but if you have tried hiking in the Indian Peaks Wilderness, particularly above 9500 feet, there is still plenty of snow on the ground, much more than is normal for this time of year. A quick check of the basin averaged snowpack water equivalent across Colorado shows some astounding numbers particularly in Southwest Colorado:
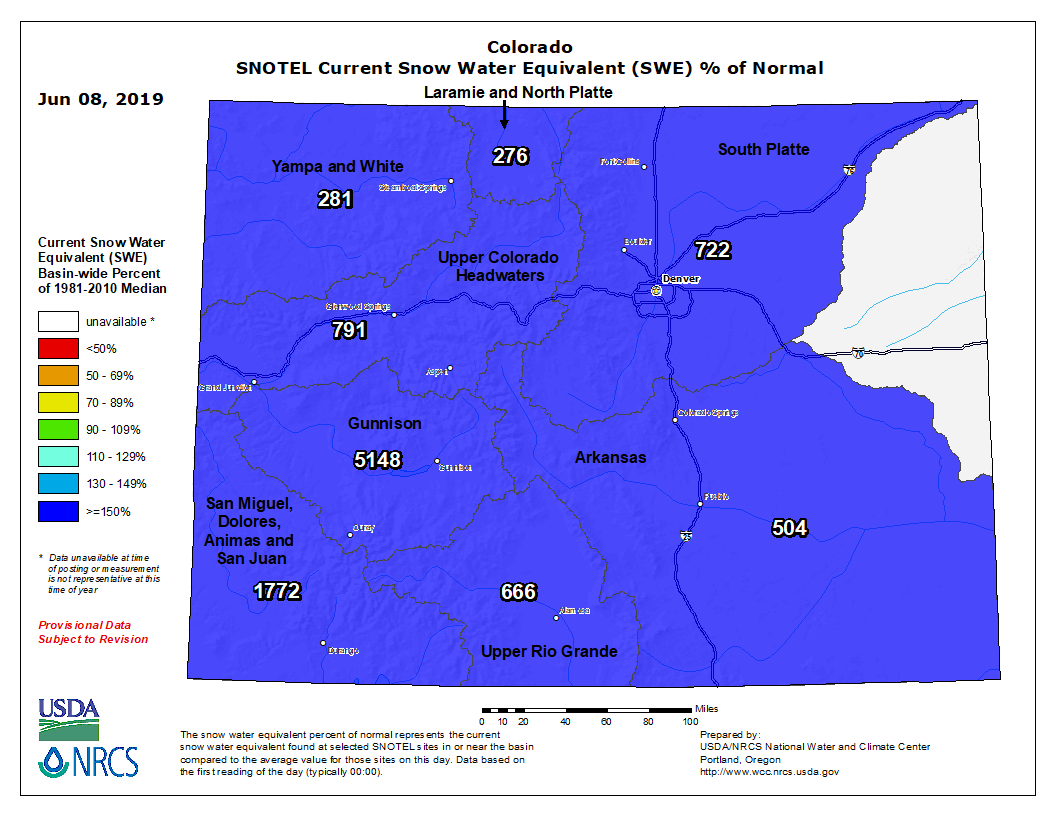
Some locations in the San Juan Mountains and the West Elks currently have snow packs which are over 2000 percent of normal. Even here in the Indian Peaks (the east side of which is in the South Platte River Basin) the snowpack is over 700 percent of normal.
What exactly does this mean? Does it mean that the Indian Peaks received over 700 percent of normal snowfall for the season? To answer that we need to take a closer look at the data, particularly at how the snow pack has trended during this past winter season here in northeastern Colorado. The Natural Resources Conservation Service (NRCS) maintains a network of automated snow measuring stations across the western United States called SNOTELS. These stations report snow depth, snow water equivalent (as known as SWE), and liquid precipitation as well as many of the standard meteorological parameters. There are several SNOTEL stations in the Indian Peaks east of the Continental Divide near Nederland. Here is a timeseries plot of SWE at the University Camp SNOTEL located at just over 10000 feet on Niwot Ridge above Ward. This plot is for the water year which spans from October 1st through September 30th:
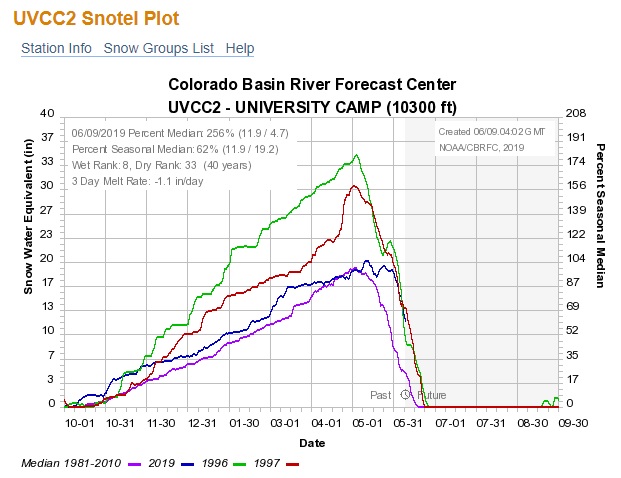
There is a lot of information on this chart including data from several water years. Our current water year, Oct 1, 2018 – September 30, 2019 is the blue line, and it shows how the snow pack in the Indian Peaks has been steadily increasing since early last fall. It also shows that the peak SWE was just over 20 inches, and this occurred in early May. The purple line shows the median snow pack for water years 1981 through 2010. An important take away from this chart is that the snowpack this year – at least in the Indian Peaks – has not been been exceptionally above normal (the purple line tops out at 19 inches). The key difference between our year and a normal year is when the snowpack started to really melt. In a normal year, it starts to melt in early May. This year, it started melting in early June. Normally in early June, there is about 3 inches of snow left at the University Camp SNOTEL. This year, because of the cold spring, and the slow melt off, there is still about 12 inches of snow left. According to my records, the average temperature in May was over 6 F degrees below normal.
Note that the red and green lines show the SWE at University Camp during years with record snowpack, and these were significantly higher than the snow we received this year.
Let’s take a look at a SNOTEL in the San Juans. Here is a graph from the Molas Lake SNOTEL located at about 10500 feet. Again, the blue line represents data from this water year, the purple line represents the median for 1981-2010 and the red line represents the record water year – 1995:
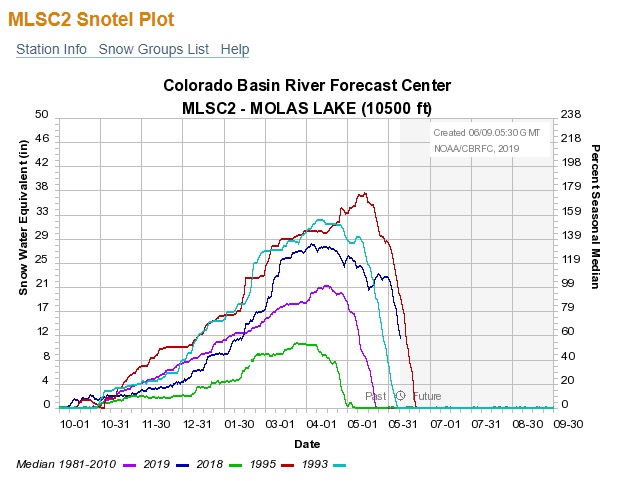
We see the same pattern of delayed melt off due to our colder than normal spring. However, the San Juans did see significantly more snowfall than normal this year, peaking out at about 28 inches of liquid equivalent. A normal year sees about 21 inches. Right now at Molas Lake, there is about 12 inches of SWE. Normally by early June the snow is gone there. If you divide 12 by a very small number, you get a very big number. Hence the large snowpack percentages we are currently seeing there.
The upshot of all of this is that much of Colorado did receive above normal snowfall this past winter, particularly the southwestern part of the state. We have had a colder than normal spring, and this has slowed down the snowmelt in our mountains, delaying it by as much as a month. The high basin-averaged SWE percentages tell water managers that there is much more snow left to melt, and as a result stream flows could be very high early this summer, particularly if reservoirs fill up and start spilling. A rapid warm up and the resulting increase in snowmelt could also result in flooding along rivers and streams.